Viewing the Dashboard
The
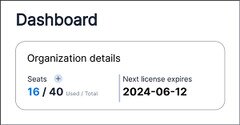
Dashboard shows information about your plan such as the number of seats and license expiration date. It also gives an overview of each group's device connection status, content deployment status, and content usage.
Here's how to view content usage for a group:
-
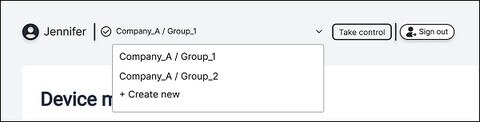
Tap the current organization and group in the upper left to open a dropdown menu, then select the organization and group where you want to check for content usage.
-
Using the filters in the upper right of the
Content usage section, you can do the following:
- Display data as a
Trend chart or
Total chart.
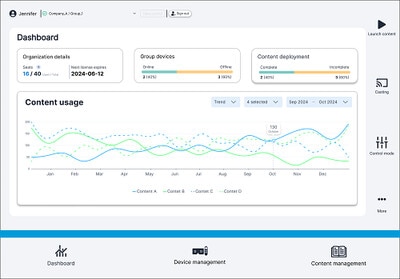
Trend chart
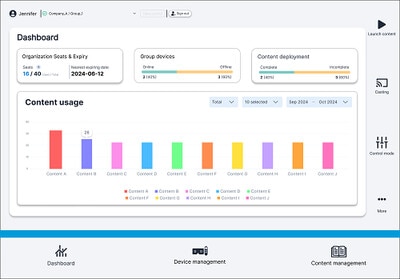
Total chart
Note: Chart view is currently not supported and will be available in future updates. - Select modules. You need to tap all the modules in the dropdown menu to select all modules.
- Select the time frame of content usage you want to view.
- Display data as a
Trend chart or
Total chart.
Tip: To add more seats to the current organization, tap the add button  next to
Seats, enter the organization's activation code, and then tap
Submit.
next to
Seats, enter the organization's activation code, and then tap
Submit.
next to
Seats, enter the organization's activation code, and then tap
Submit.
此内容对您有帮助吗?
是
否
谢谢!您的反馈可以帮助其他人了解最有用的信息。