Environment Simulation Service
The Environment Simulation Service can help you determine whether your play area is suitable for tracking before you commit to certain designs and specifications for your play area.
This service evaluates the potential tracking performance of your environment by simulating headset movements inside a virtual model of your play area. If any potential issues are found, you can simply make adjustments to the design of your environment as needed. When you're finished, you can submit your new design for another simulation.
This way, you won't have to make any significant changes you've already built your play area, which can help to improve efficiency and reduce costs.
Because a virtual model is used for evaluating tracking performance, certain variables can't be accounted for; this includes lighting, players, and other dynamic elements of the environment.
Requirements:
For us to create an accurate virtual model of your play area, we'll need data about your environment. Here's what you'll need to provide:
- Interior measurements and dimensions of the space, including measurements for any interior walls or fixed objects
- Scene meshes and textures in common 3D model file formats (for example, FBX, DAE, and OBJ)
- Pattern designs for floors and walls, preferably in a vector file format (for example, AI, PDF, DWG, CDR, and EPS)
- The headset model you plan to use (Focus 3, XR Elite, etc.)
- If you can't provide vector files, you can submit PNGs along with the corresponding resolution in pixels. If you're not sure how to convert physical measurements to pixels, you can try an online converter such as https://www.blitzresults.com/en/pixel/.
- Scene meshes and textures are required in order to analyze complex environments. However, if the space you want to use as your play area has a simple, symmetrical shape and doesn't contain any partitions, room dividers, or interior walls, we can still create a 3D model suitable for analysis.
About environment simulations
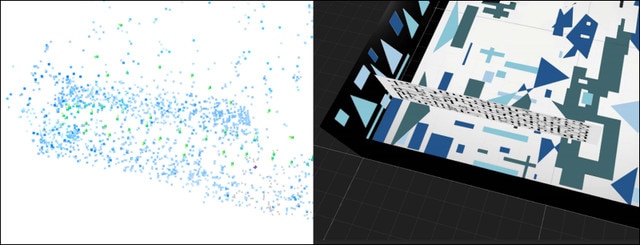
The images generated during environment simulations are used to generate mappoints, which are then used to create an LBE tracking map. Mappoints are specific locations in the environment that are used for identifying the physical characteristics of the play area. The number and distribution of mappoints indicates potential tracking performance during play or the ability to recognize the play area.
The duration of an environment simulation varies depending on the complexity of the physical environment.
Environment simulation reports
-
Mappoint distribution
Mappoint density is the number of mappoints generated per unit in an environment simulation. A unit of the environment is defined according to the scale of the model in Unity, which is used to perform environment simulations. Distribution is calculated using the average distance between mappoints and the standard deviation.
Trial 1 Trial 2 Trial 3 Mappoint density (pts/unit) 4.95 4.68 4.94 Average distance (m) 0.189 0.193 0.183 Standard deviation (m) 0.241 0.251 0.182 -
Mappoint summary
The results of the three simulation trials are then averaged and provided in a summary table.
Trial average Mappoint density (pts/unit) 4.85 Average distance (m) 0.188 Standard deviation (m) 0.224 -
Relocation performance
The Environment Simulation Service also evaluates the relocation performance of your play area by calculating how long it takes to retrieve the headset's position (relocation time) at five different positions during headset movement simulation.
In the table below, the Frame ID is the number that identifies the set of images captured by the headset at a specific point in time. The Frame ID is used to determine the headset's position in the environment at the time the images were captured.
Frame ID Relocation time (s) 0 0.157 1600 0.691 3200 0.514 4800 0.493 6300 0.685 Average relocation time 0.508 -
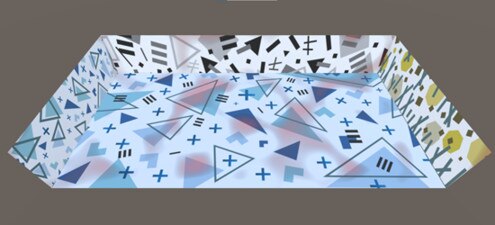
Tracking performance visualization
There are two available views for the virtual model of the play area: Mappoints and Heatmap. In both views, you can move, scale, and rotate the model.
Move Ctrl + drag Scale Ctrl + scroll Rotate Alt + drag -
In Mappoints view, all mappoints are overlaid on the environmental patterns so it's easy to identify which areas are conducive to generating mappoints.

-
In Heatmap view, areas with low mappoint density are indicated by red shading. The darker the red shading is, the lower the tracking performance will be. These areas should be modified as needed.
-